The Project
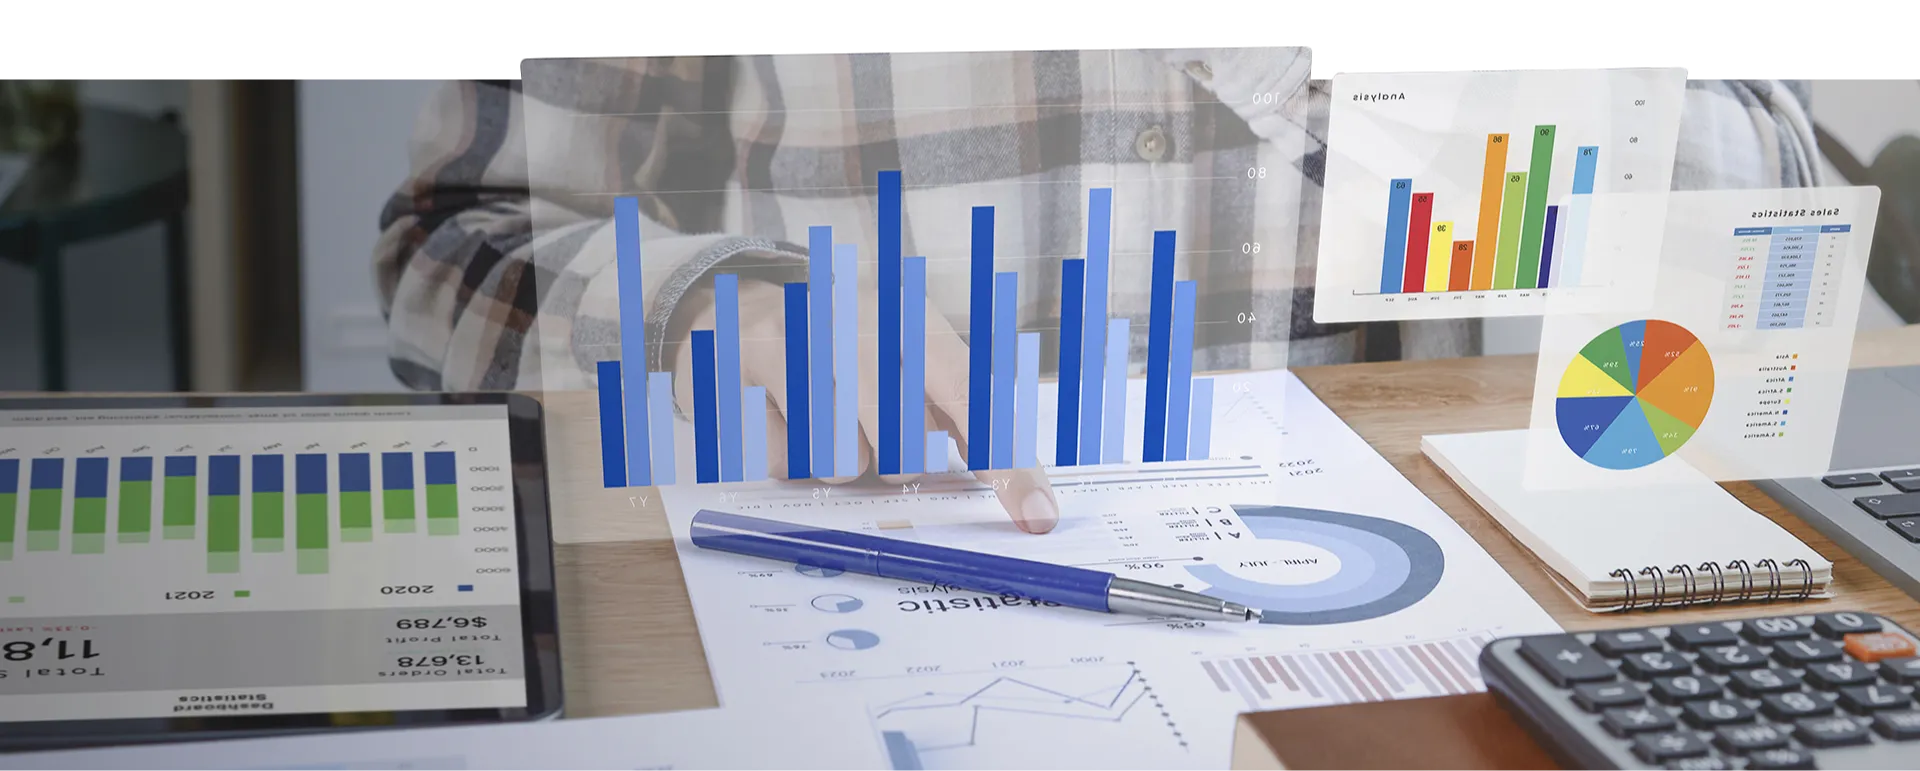
Because of their AI solution, the customer needed to visualize information with different diagrams and charts.
- 1 Full-Stack Engineer
- 1 QA Engineer
- 1+ years of collaboration (ongoing)
The Solution
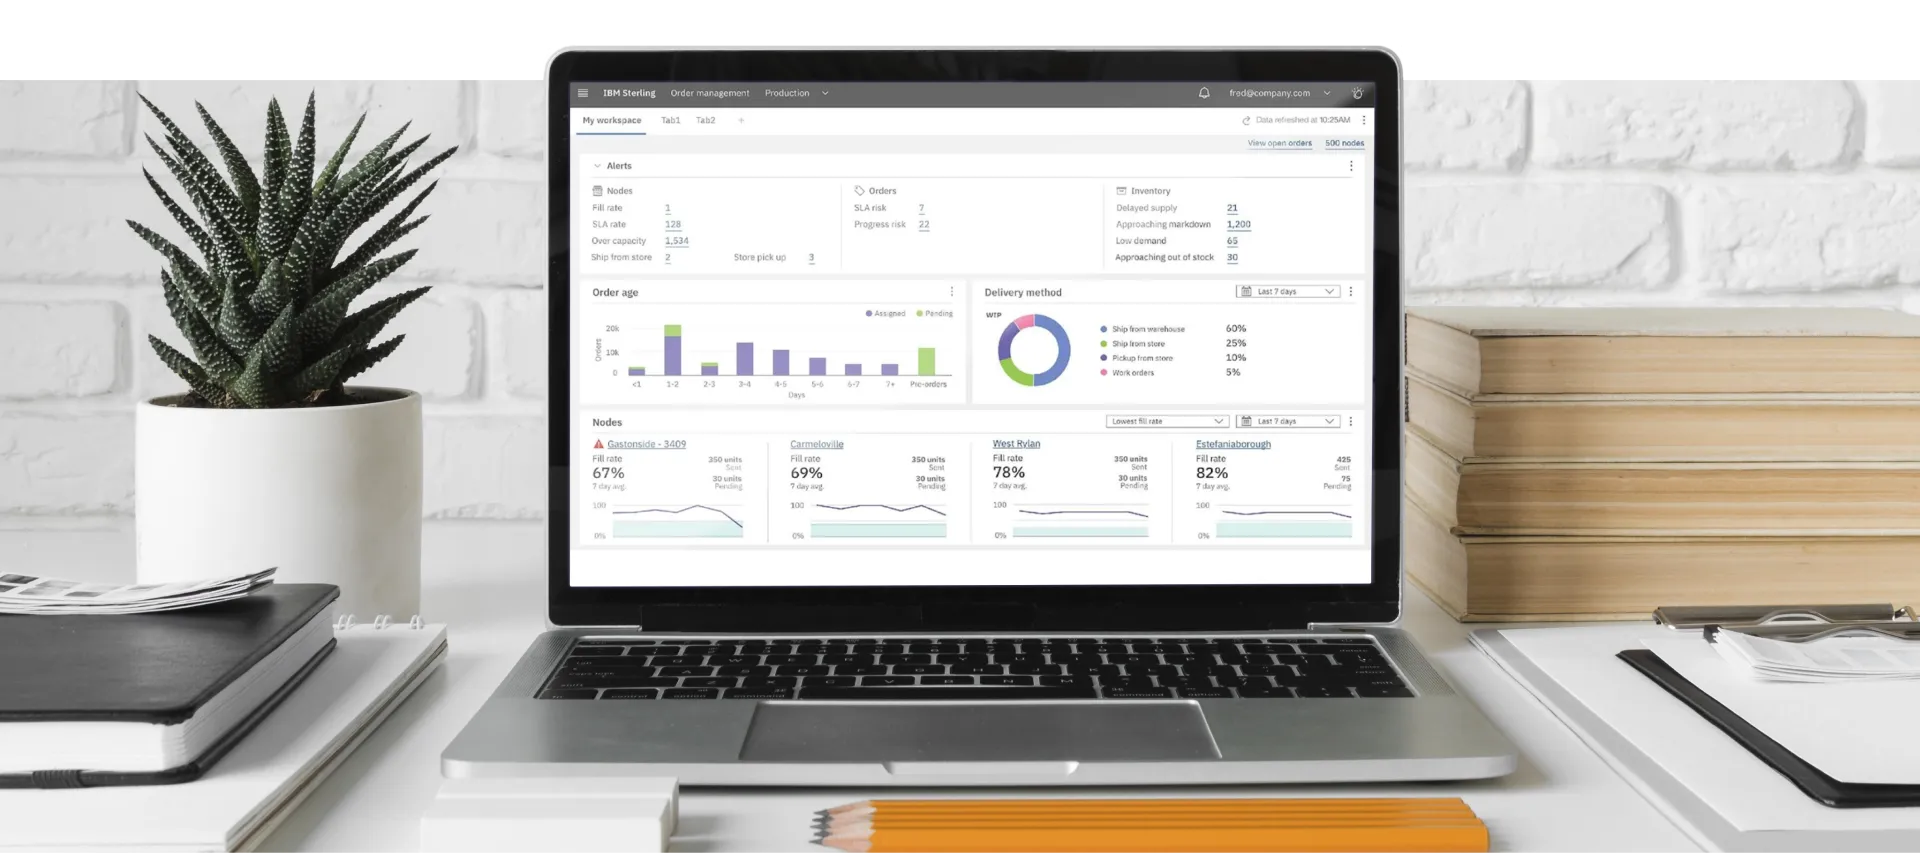
The resulting solution must display results of the AI component.
We’ve developed a web application for gathering information about sales and presenting a view of it in several forms. It included ABC analysis, diagrams, and reports.